Appearance
Analytics: Fleet Analytics
The Fleet Analytics tab is a ready-made health report on all your equipment. It doesn't need any filters: it looks at every device you have access to, finds what needs attention, and tells you what to do about it.
Open Analytics in the sidebar and click Fleet Analytics.
Who can see it: everyone, for the devices they have access to.
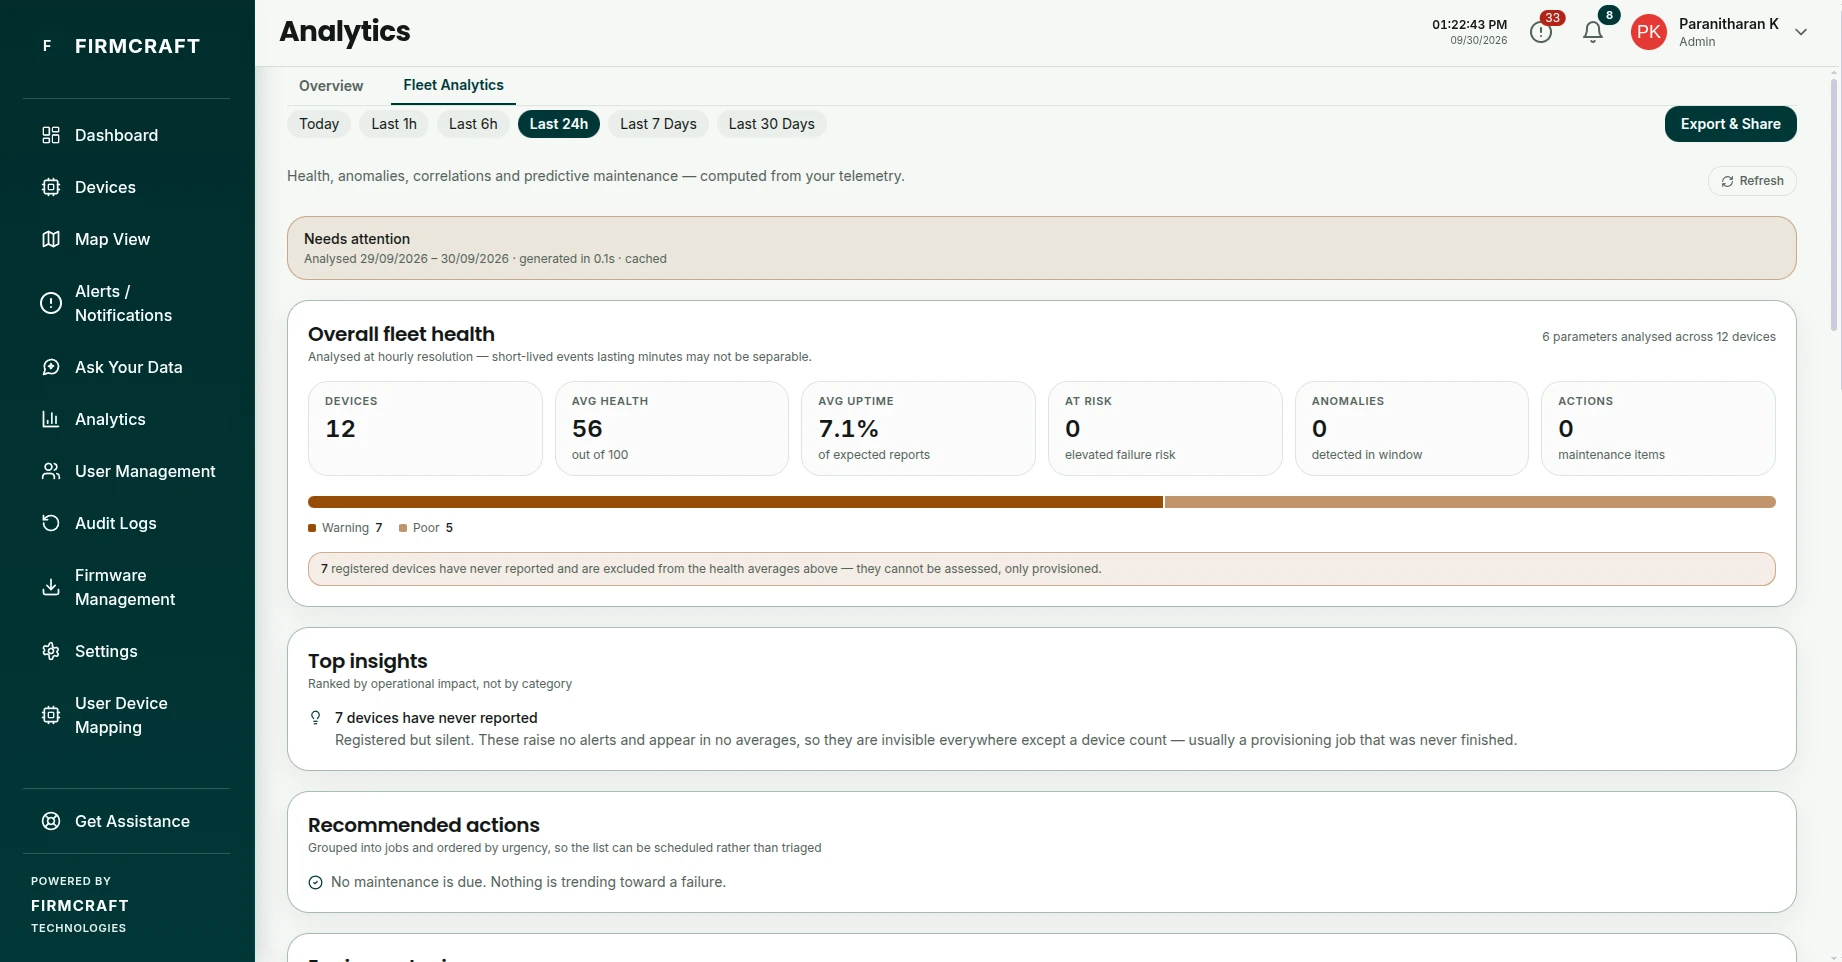
Choose the period
Use the buttons at the top to pick the period the report covers: Today, the last 1h, 6h, 24h, 7d or 30d.
What's in the report
| Section | What it tells you |
|---|---|
| Overall fleet health | A single view of how the fleet is doing. |
| Top insights | The most important findings, ranked by their effect on operations. |
| Recommended actions | What to do, grouped into jobs and ordered by urgency. |
| Fleet ranking | Best and worst performing, most reliable, most interrupted, most alerts, and needing maintenance. |
| Device health | Every device with a health score, uptime, outages and alerts, least healthy first. Open a device to see what drove its score. |
| Anomalies | Behaviour that's wrong without crossing a threshold, so it never raised an alert. |
| Correlation analysis | Metrics that move together across the fleet, as leads to check. |
| Preventive maintenance and Predictive risk | Devices likely to need work soon, and why. |
| Sensor health | Whether readings can be trusted: drift, frozen values and noise. |
Depending on what your devices measure, the report adds sections for energy, environmental, battery, vibration & machine and agricultural analytics.
Export
Use Export & Share at the top of the tab to save the report as a PDF or an interactive HTML file.
The same report is attached to the weekly report email.