Appearance
Connect a LoRaWAN network server
The Firmcraft IoT Dashboard reads LoRaWAN sensor data from your network server's MQTT integration. Your LoRaWAN application becomes a gateway in the IoT Dashboard, and each end device in it becomes a child device.
Supported network servers:
- ChirpStack v4
- The Things Stack v3, including The Things Network and The Things Stack Cloud
Who can do this: Admin User
How it works
LoRaWAN sensors ──radio──▶ LoRaWAN gateways ──▶ Network server ──MQTT──▶ IoT Dashboard
                                                (ChirpStack / TTS)
The IoT Dashboard connects to your network server's MQTT broker and subscribes to your application's uplinks. Your network server's payload decoder turns each sensor's bytes into readings such as temperature, and the IoT Dashboard stores those. No decoder? The IoT Dashboard can read numbers out of the raw bytes.
What you need from your network server
| ChirpStack v4 | The Things Stack v3 | |
|---|---|---|
| Application ID | The application's ID (a UUID, shown in the application's URL) | The application ID, such as my-sensors |
| Tenant | Not needed | ttn on The Things Network, otherwise your Cloud tenant name |
| Broker address | Your ChirpStack server's MQTT broker, such as chirpstack.example.com | Your cluster's address, such as eu1.cloud.thethings.network |
| Username / Password | Only if your broker requires them | Username: <application-id>@<tenant>. Password: an API key with the right to read application traffic. |
| Child Device IDs | Each end device's DevEUI | Each end device's device ID |
The IoT Dashboard must be able to reach your broker
The IoT Dashboard connects to your network server's MQTT broker over the internet. A ChirpStack server on a private network needs its MQTT port opened, or forwarded, for the IoT Dashboard.
Steps
1. Get a sample uplink
Open your network server's live event view, or subscribe with an MQTT tool, and copy one uplink ("up") event as JSON. It looks similar to this ChirpStack v4 uplink:
json
{
  "deviceInfo": {
    "applicationId": "0f2b7e3c-5a1d-4c7e-9b1a-2d4e6f8a0b1c",
    "deviceName": "cold-room-1",
    "devEui": "a84041000181c4a1"
  },
  "fCnt": 42,
  "fPort": 2,
  "data": "CJY2DhI=",
  "object": { "temperature": 21.98, "humidity": 54, "battery_mv": 3602 },
  "rxInfo": [{ "rssi": -87, "snr": 9.5 }]
}
2. Add the gateway
Open Devices → Add Device → Add Gateway. Follow Add a gateway, with these values:
Step 1 — Gateway Information
- Gateway Name: your application's name, such as
Cold Rooms LoRaWAN.
Step 2 — Connection Configuration
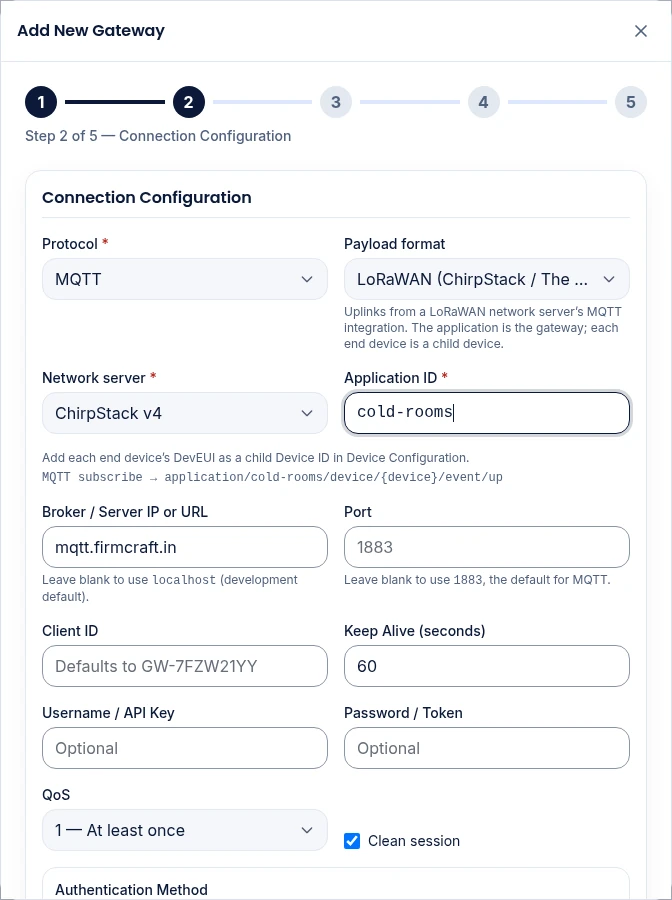
| Field | Value |
|---|---|
| Protocol | MQTT |
| Payload format | LoRaWAN (ChirpStack / The Things Stack) |
| Network server | ChirpStack v4 or The Things Stack v3 (incl. The Things Network) |
| Application ID | Your application ID |
| Tenant | The Things Stack only: ttn, or your tenant |
| Broker / Server IP or URL | Your network server's MQTT broker |
| Port | 1883 for plain MQTT, 8883 for TLS |
| Authentication Method | Username & Password if your broker needs a login, otherwise None (anonymous) |
| Username / API Key, Password / Token | As in the table above |
The wizard builds the topic for you and shows it under the fields:
- ChirpStack v4:
application/<application-id>/device/{device}/event/up - The Things Stack:
v3/<application-id>@<tenant>/devices/{device}/up
{device} is where each end device's ID sits in the topic, which is how the IoT Dashboard tells your sensors apart.
For TLS (port 8883): tick Enable TLS / SSL, and paste your broker's root CA certificate into CA Certificate (PEM). See Secure connection.
Step 4 — Payload Mapping & Device Discovery
- Paste your sample uplink into Sample LoRaWAN uplink (JSON).
- Click Detect Structure & Auto-Map. Your decoded readings (
temperature,humidity, …) are mapped automatically. - Click Test Mapping to check the values.
You only paste one end device's uplink. One mapping serves every end device in the application.
Step 5 — Device Configuration & Alerts
Add each end device as a child:
- Device ID: the DevEUI (ChirpStack) or device ID (The Things Stack), such as
A84041000181C4A1. Upper or lower case both work. - Alias: a friendly name, such as
Cold Room 1.
Click Submit Gateway.
3. Check the data
Wait for your sensors' next uplinks. The gateway turns Online with the first one. Open the gateway, then a child device, to see its readings update live.
What the IoT Dashboard stores for each uplink
| Stored as | Comes from |
|---|---|
Your readings (temperature, …) | The network server's decoded payload (object in ChirpStack, decoded_payload in The Things Stack) |
bytes | The raw frame as hex, for reading values yourself |
Radio values: rssi, snr, frequency, spreading_factor, f_cnt | The LoRaWAN gateway that heard the uplink best |
If an uplink leaves out a reading, that reading keeps its last value.
Sensors without a payload decoder
If your network server has no decoder for a sensor, its uplinks carry only raw bytes. You can still read values out of them in the mapping step:
- In step 4, add a Device Telemetry mapping with JSON Path
bytes. - Open Transform value and choose Convert → Read from bytes.
- Choose the Byte type and Byte offset from your sensor's datasheet.
- Use Multiply by to scale the value.
- Set the Dashboard Field to the metric, such as
temperature.
Example: a sensor that sends temperature as a signed 16-bit number in hundredths of a degree in bytes 0–1, humidity as 1 byte at byte 2, and battery millivolts as an unsigned 16-bit number at bytes 3–4:
| Metric | Read from bytes | Byte offset | Multiply by |
|---|---|---|---|
| temperature | Signed 16-bit, big-endian | 0 | 0.01 |
| humidity | Unsigned 8-bit | 2 | |
| battery_mv | Unsigned 16-bit, big-endian | 3 |
See Value transforms for every option.
Common problems
"Application ID is required for LoRaWAN." Enter the Application ID in step 2.
"Application ID and tenant cannot contain /, +, # or spaces." Copy the ID exactly as your network server shows it.
The gateway is Online but a sensor shows nothing. The sensor's DevEUI or device ID isn't a child in step 5, or is spelled differently. See Gateway data not arriving.