Appearance
Add a gateway
This page walks through the Add Gateway wizard step by step. For LoRaWAN or Sparkplug B, also read Connect a LoRaWAN network server or Connect a Sparkplug B edge node; they explain the fields that differ.
Who can do this: Admin User
Before you start
Have these ready:
- One sample message from your gateway, copied from its web page, its logs or an MQTT tool such as MQTT Explorer. The wizard reads it to find your devices and readings.
- The topic your gateway publishes on, and the broker it publishes to.
- The IDs of the child devices, such as meter slave IDs, DevEUIs or Sparkplug device names.
Open the wizard
- Open Devices in the sidebar.
- Click Add Device, then choose Add Gateway.
The wizard has five steps. Required fields are marked with a red *.
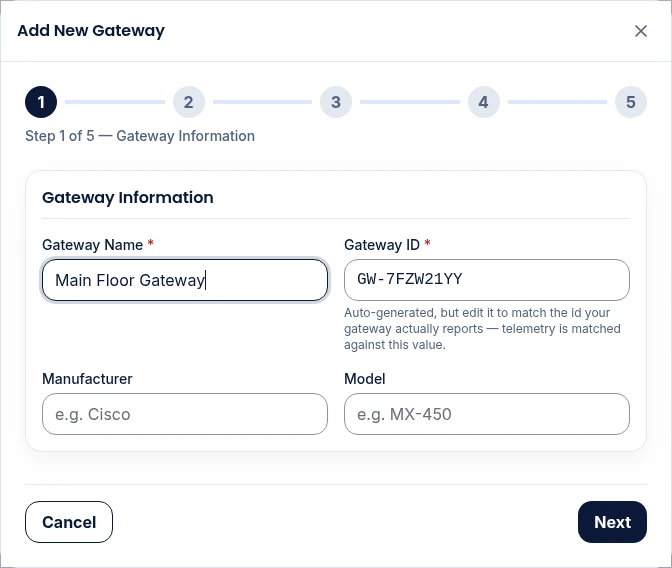
Step 1: Gateway Information
| Field | What to enter |
|---|---|
Gateway Name * | A name people will recognise, such as Main Floor Gateway. |
Gateway ID * | Filled in for you. If your gateway puts its own ID in its messages, change this to match exactly, because messages are matched against it. |
| Manufacturer, Model | Optional, for your records. |
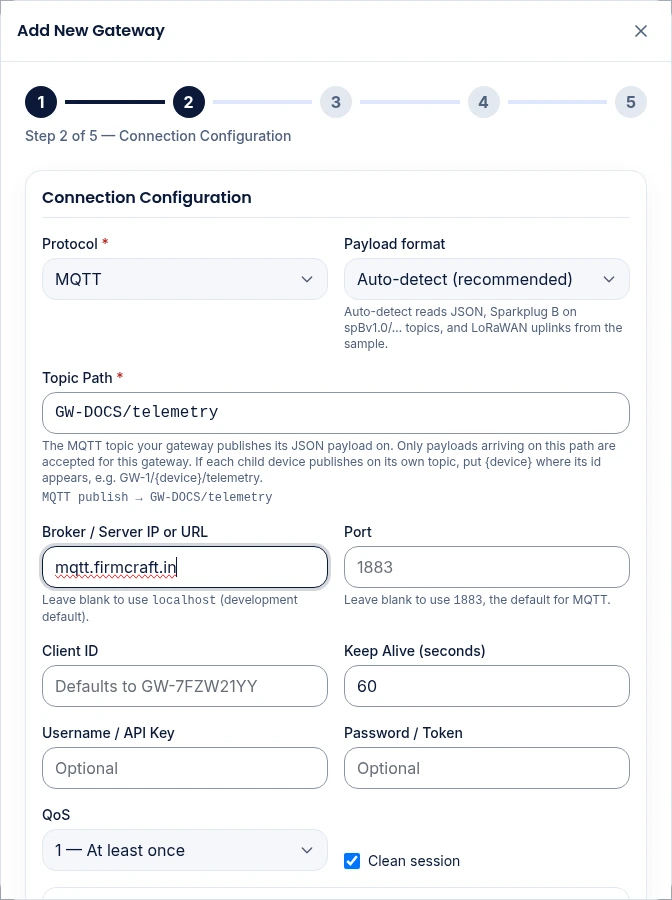
Step 2: Connection Configuration
This tells the Firmcraft IoT Dashboard where to listen for your gateway's messages.
| Field | What to enter |
|---|---|
Protocol * | MQTT for most gateways. |
| Payload format | Leave on Auto-detect (recommended) unless you know it. See Choose a payload format. |
Topic Path * | Filled in as <Gateway ID>/telemetry. Change it to the topic your gateway really publishes on. If your gateway puts each child's ID in the topic, put {device} where the ID sits: GW-1/{device}/telemetry. |
| Broker / Server IP or URL | mqtt.firmcraft.in to use the IoT Dashboard's broker, or your own broker's address. |
| Port | Leave blank for the protocol's default. |
| Authentication Method | Self-Signed Certificate for the IoT Dashboard's broker. Username & Password or None (anonymous) for your own broker, as it requires. See Secure connection. |
| Client ID, Keep Alive, QoS, Clean session | The defaults suit most gateways. |
The IoT Dashboard connects to the broker you name
The IoT Dashboard subscribes to your Topic Path on that broker. If it's your own broker, it must be reachable from the internet, and the username and password you enter must let the IoT Dashboard subscribe to the topic.
Step 3: Location, Ownership & Settings
- Site / Plant / Facility
*: pick an existing site or type a new one. - Place, Zone / Floor / Section, Latitude, Longitude: optional. Latitude and longitude put the gateway on the Map view.
- Data Reporting Interval and Interval Unit: how often the gateway sends. Optional.
- Notification Preferences: how you want to hear about alerts: Email, SMS, Dashboard.
- Advanced Settings and Firmware Update: only needed for over-the-air firmware updates.
Step 4: Payload Mapping & Device Discovery
This is where the IoT Dashboard learns to read your gateway's messages.
Paste your sample message into the box.
Click Detect Structure & Auto-Map. The IoT Dashboard finds the child devices and readings in the message and fills in the mappings.
Check the Devices found list: these are carried into step 5 automatically.
If your message isn't detected automatically, or some readings are missing, map them by hand:
- Device Telemetry: click Add Device Telemetry Mapping for each child reading. Enter its JSON Path, pick the Dashboard Field, and choose the Device it belongs to, or All devices.
- Gateway Overview: click Add Gateway Overview Mapping for each of the gateway's own values, such as uptime or signal strength.
If Devices found says None detected, add the child devices by hand in step 5.
Click Test Mapping to see exactly what would be stored.
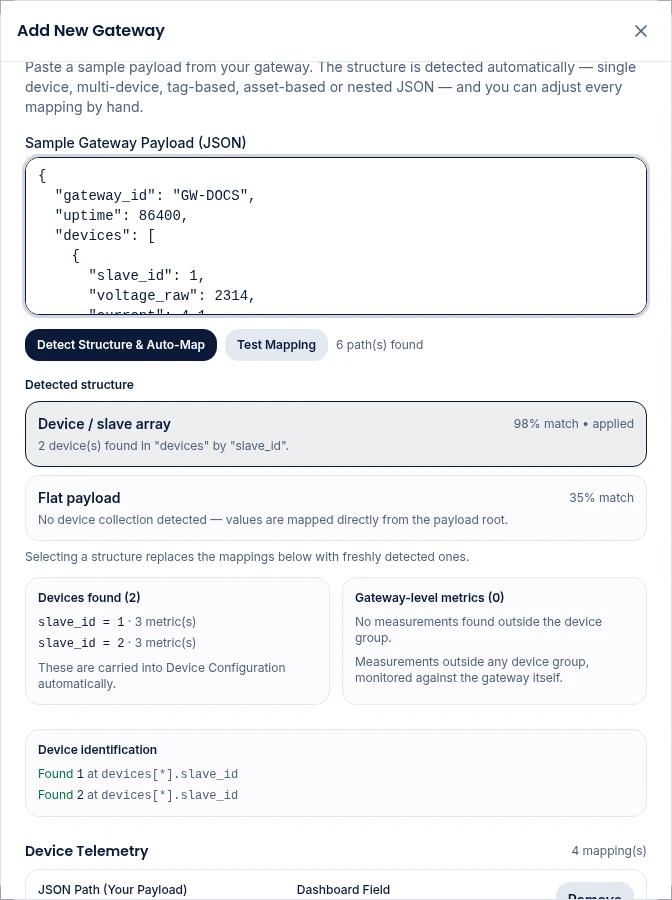
This step is covered in detail in Payload mapping, Value transforms and Test Mapping.
Step 5: Device Configuration & Alerts
Sensor Parameters to Monitor lists the child devices. Devices found in step 4 are already here. For each child:
| Field | What it's for |
|---|---|
| Identifier Field | The field in the message that holds the child's ID, such as slave_id. Not needed when the ID is in the topic. |
Device ID * | The child's ID exactly as the gateway sends it, such as 5 or EM001. Upper and lower case are treated the same. |
| Alias | A friendly name shown on the dashboard, such as Boiler Room Meter. You can change it later. |
| Metric and Unit | The readings this child reports. Click Add Metric for more. |
Click Add Device to add a child that wasn't in your sample.
Under the Device ID, the IoT Dashboard checks your sample:
- Found in the sample at …: the ID is where you said it is.
- Not under "…" in the sample; it is at …: the Identifier Field is wrong. Correct it.
- This id does not appear in the sample payload.: fine if this child simply wasn't in your sample; otherwise check the spelling.
Alerts & Thresholds lets you pick a child, a parameter and a Min Threshold and/or Max Threshold. Add alert level adds up to three stricter levels, such as Critical above a value. See Extra alert levels. You can also add these later.
A gateway uses one of your plan's Monitored Units per child device, not per metric.
Click Submit Gateway.
What happens next
The gateway appears on the Devices page. It shows Online when its first message arrives, which can take up to 30 seconds after you submit. Click it to open the gateway page and its child devices.
Change a gateway later
To change a gateway's connection, child devices or mapping, open Devices in the sidebar (dashboard.firmcraft.in/devices). The Device Management page lists gateways alongside devices. Click Edit on the gateway's row.
Common problems
"Your subscription limit was reached." Your plan's device or metric limit is full. Remove unused devices or metrics, or upgrade your plan.
"This gateway requires N capacity unit(s), but only M unit(s) remain in your subscription." Each child device and metric uses part of your plan. Reduce them, or upgrade.
The gateway stays Offline. See Gateway data not arriving.